News Analysis
Get to Know Your Grid
Josh Radoff contributed to this article.
The green building community is abuzz with the concept of decarbonization through electrification—the use of electric technologies instead of combustion-fueled technologies to supply the comforts of a modern building. But is it a good idea for your project? It may depend on how clean the regional grid is, along with how clean it’s going to become in the next decade or two.
That’s a surprisingly tough thing to research, but there are some tools that can help—including a new one called Cambium, just released by the National Renewable Energy Laboratory (NREL).
The new Cambium tool from the National Renewable Energy Laboratory predicts future hourly grid data. The map (upper left) shows how much onshore wind is projected to be installed in each state by 2050. On the upper right are projections for how the national grid will evolve by 2050, with the yellow bars showing an large uptick in solar power. The other charts show how marginal carbon emission rates are likely to vary over each day and each year (bottom left) and hourly data on what generation types are projected to generate at different times (bottom right).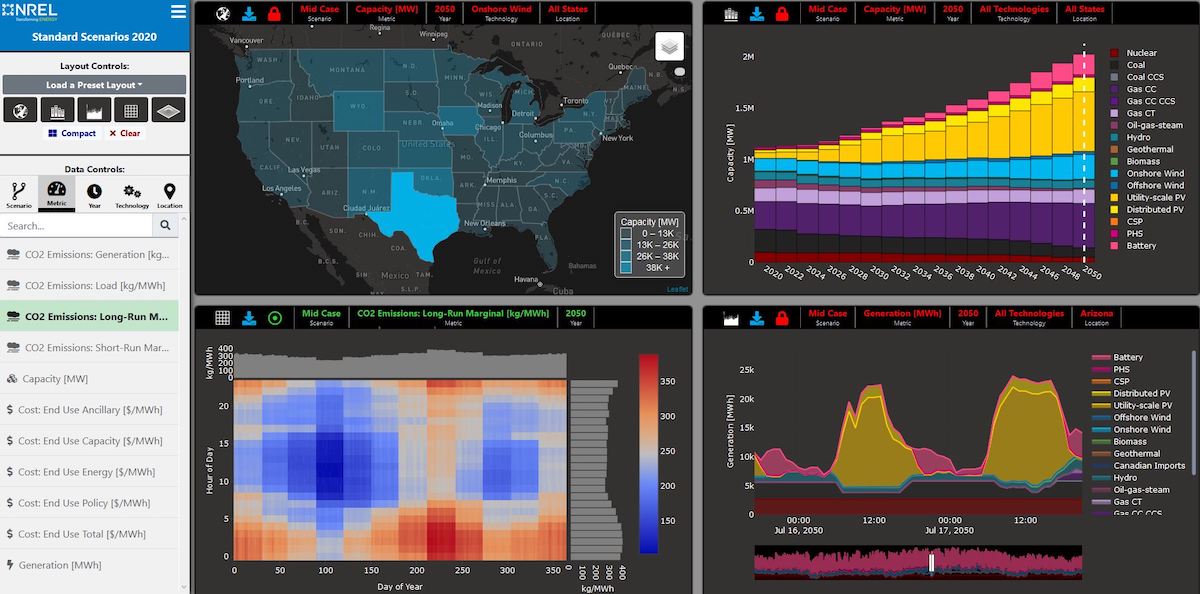
Average vs. hourly
First, it’s important to understand the value of grid data to building design.
There are basically two ways to use it: you can get an overall sense of average greenhouse gas emissions and use that to inform a decision about whether to electrify, or you can download hourly data and apply it to a model to help inform project design directly.
The latter approach can help you determine the cost and carbon emissions associated with the daily cycle of the building’s operation, then optimize operations for the lowest cost and emissions. Hourly data also helps if you anticipate plugging in to a demand-response program, which is an agreement with a utility to reduce power use during times of high demand on the local grid.
Past and present data
These tools can help you get a sense of how clean your grid is right now:
- AVERT—This U.S. Environmental Protection Agency (EPA) tool is referenced in the LEED Zero program as a way to calculate carbon emissions from the grid on an hourly basis. The files are released annually and currently go through 2019.
- eGrid—Also developed by EPA, the Emissions & Generation Resource Integrated Database (eGRID) reports past environmental impacts, including resource mix and carbon dioxide and methane emissions, of regional grids. The current data year is 2018. The associated Power Profiler allows users to get an idea of how clean a regional grid was on average but doesn’t provide hourly data.
- electricityMap—A real-time tool, electricityMap shows the emissions profile resulting from consumption of electricity at a particular time in the indicated region. Different colors indicate differing carbon intensity levels, from green (low carbon intensity) to a deep reddish-brown (high carbon intensity). By hovering over a section of the map, you can also see how much of the grid is low-carbon and how much is renewable. The maps are international, and it’s possible to purchase the data.
- WattTime—WattTime is a powerful, subscription-based tool that can be used by utilities and end users to facilitate demand response. On the WattTime home page is a free widget into which you can enter a zip code and find out how clean that area’s grid is at any given moment.
Future data
Buildings are with us for the long term, though, so it would be ideal to see what the grid is going to look like, not just what it looks like right now. This is where things get a little sketchier.
Colorado has a long way to go to reach its carbon-free electricity goals.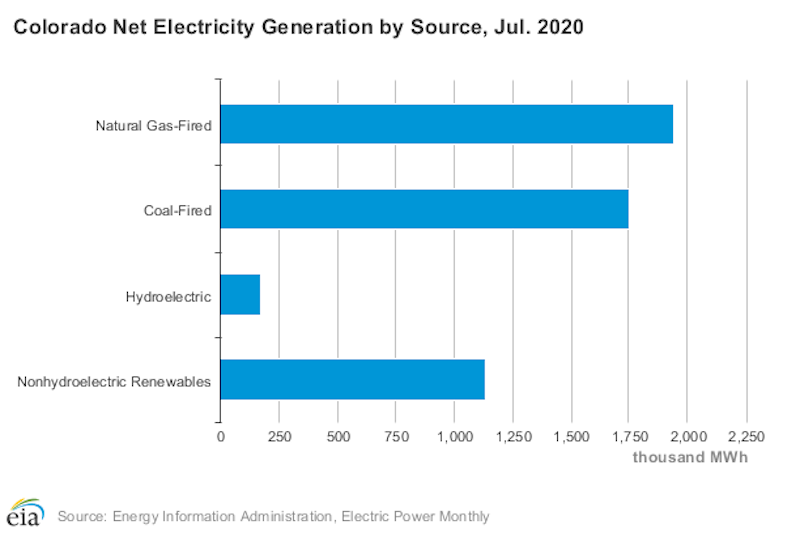
If that’s not enough for you, consider the new NREL tool called Cambium.
With “more wind and solar power on the grid, that changes the dynamics of what it means to use energy at the building level,” said Elaine Hale, Ph.D., senior research engineer at NREL. “The grid is becoming something different than it was.” Cambium is designed “to help people understand how the grid is changing so they can be proactive about what they’re designing for.”
“One very important question is: what is the emission impact of electrifying?” according to Pieter Gagnon, engineering analyst of energy policy and technoeconomics at NREL. “Should we electrify this particular service in the building? You are weighing between the emissions impact of electrification or the alternative.” But if you are only asking about the emission impact of today’s (or last year’s) grid, you are missing the fact that the grid will likely “be cleaner than what you would otherwise expect,” he said.
Cambium projects future grid scenarios, down to hourly data. It should offer a clearer idea than any other tool of how clean a grid will be between the current time and 2050. Users can see what their grid is going to do on an average or hourly basis going forward 15 or 30 years (the life of the HVAC equipment or solar), or they can couple it with an energy model to see the hourly impacts of their building and devise a control strategy that optimizes for those patterns.
Cambium forecasts are useful for planning and design, but you need a real-time source (or at least Cambium’s current-year model) to calculate actual operational carbon.
More on electrification and grid harmonization
Meet the People Preparing to Amp Up Building Electrification
Building Electrification: A Vital Solution to Climate Change
Published November 9, 2020 Permalink Citation
Melton, P. (2020, October 22). Get to Know Your Grid. Retrieved from https://www.buildinggreen.com/news-analysis/get-know-your-grid
Add new comment
To post a comment, you need to register for a BuildingGreen Basic membership (free) or login to your existing profile.